What makes uv slow?
Contents
A lot has been said about uv being fast, but not about how and when uv is slow. Let's talk about both.
The paragraphs are in no particular order, except the first two (overview and benchmarks) and the last one (tooling).
Overview
We get a lot of questions what the hidden magic for uv's performance is, or if there are shortcuts we're taking, but in practice it's mainly two things: Trying optimizations that worked well for others, and a loop of profile, poke at the code, benchmark, PR, repeat.

Figure 1: A monotreme by @fag@shrike.club
If you're mainly interested in the core resolver algorithm, head over to the uv resolver internals, the pubgrub introduction and the pubgrub-rs guide. They cover the subject in-depth, i'll only touch on them briefly.
In general, what's slow is always roughly the same. From high-level to low-level:
- Invoking external (build) tools
- Network requests
- cpu-heavy code, such as (de)compression, hashing, parsing and constraint solving
- Disk reads and writes
- Singlethreaded and synchronous code
- Allocating, memory copies and syscalls
Optimizations happen roughly in that order. Consider for example installing packages: First, the transition from source distributions to wheels removes invoking build tools each time. Then, caching wheels reduces network requests with disk reads. Switching that cache to unzipped wheels skips the repeated decompression step. Reflinking/hardlinking turns file read/writes into link read/writes, eliminating large disk reads and writes. Each of those is sped up proportionally by multithreading and IO concurrency, while avoiding allocations, memoization, faster hashmaps and similar local optimizations remove the remaining bottlenecks throughout the stack.
uv uses existing heavily optimized implementations of staple cpu-heavy algorithms, such as (de)compression, hashing, http parsing, etc. 1; classic "Big O" optimizations are rare. The one exception is pubgrub, but that exists as a library outside uv.
The benchmarks cover roughly the first half of 20262.
Benchmarks
There's two big high level tasks in uv: Resolving dependencies (uv lock, uv pip compile) and installing packages (uv sync --locked, uv pip sync). Resolving has a lot of concurrency between the resolution algorithm, network requests and (if required) source distribution builds. For installation, each package first gets a streaming download-and-unpack into the cache and then gets copied from the cache into the venv.
In this article, i'm using a few different benchmarks to cover different scenarios.
Jupyter notebook has a midsized dependency tree of 97 regular sized packages. There's nothing strange or outsized about it, it's a good average case.
Apache airflow is a massive workspace with 126 apache-* packages and 892 total packages in a resolved workspace.3 Resolving its dependencies requires some backtracking and includes some source distributions. It's useful as the biggest real example that's freely available.
Boto3 is the official interface for amazon web services. It's the most downloaded package, and it creates a new release every time aws changes. boto3 depends on botocore, which depends on a recent urllib3 version. When resolving with an old urllib3 version, such as urllib3<1.25.4 and boto3, the resolver needs to do a lot of backtracking through boto3 and botocore versions to find a boto3 version that depends on a botocore version that is compatible with urllib3<1.25.4. This is something that happens to users when they depend on one package that can use data stored on S3 and another one that requires a specific urllib3 range. We adopted it as backtracking and networking concurrency benchmark4.
Home assistant is a home automation platform that can connect to about every smart home service there is. Supporting all those diverse protocols requires a large number of dependencies, and install performance matters a lot. Despite the large number of dependencies, it's not particularly interesting as a resolution, the dependency tree is rather flat and heavily constrained. Its smaller sibling is installing transformers[torch] with fewer files and packages, but a larger on-disk size with torch's several hundreds of megabyte large binary.
Plotly is ideal as installation speed benchmark: It's a popular package with a lot of files, but only two dependencies, all three with platform-independent builds.
If you have cases that are particularly slow case (except for source distributions), please let me know!
To give you a sense of the numbers (i promise there's more pictures below), let's compare a linux desktop (fiber internet), a raspberry pi 4B (fiber internet) and a windows laptop (wifi). 5 Where not stated otherwise, numbers are from the linux desktop, with a pretty vanilla ubuntu lts and an nvme ssd.
A cold cache6 uv sync in an (already resolved) airflow checkout takes 54s on my desktop and 10.5min on the raspberry pi. The runtime is dominated by building two large packages (krb5 and gssapi) which on my desktop take 44s and 22s respectively. The two builds run in parallel, but block the sync from finishing while nothing else is running.
After the installation, uv run python -V takes 171ms on the desktop and 1.1s on the raspberry pi. This is the overhead for all the setup, discovery and freshness checks without doing an actual resolution or installation.
Installing plotly with a cold cache takes 310ms on the desktop, 2.3s on the raspberry pi and 4.8s on the windows laptop. If we instead have a warm cache from a previous installation, we get to skip the first phase with network requests and the download-and-unpack step, it remains only a very simple resolution and getting the unpacked files from the cache to the venv. The walltime goes down to 40ms for the desktop, 120ms on the raspberry pi and 900ms on the windows laptop. Windows is slow due to NTFS, on a ReFS dev drive it takes only 450ms7.
Toml parsing
Toml is a file format that's easy to write, doesn't have a lot of complexity and is compatible with a lot of json tooling, such as jsonschema. uv chose toml for uv.lock (just like poetry.lock and pylock.toml) for being user readable, and more importantly, generating good diffs when updating dependencies. Those are important for auditing dependency changes, such as through dependabot or renovate. 8
While json parsers can do 1GB/s parsing on a 10 year old laptop, rust's toml parser is slow 9. For a large project such as airflow, it takes uv ~30ms just to read and parse the lockfile. For comparison, python -c 'print("hello world :3")' is 10-15ms on my linux desktop5.
Airflow freshness check (63ms) unfiltered

Figure 2: uv run python -V in a fully synced airflow checkout. The top bar is parsing uv.lock. The many small bars are parsing workspace member pyproject.toml files for the freshness check, deciding whether the lockfile still satisfies the requirements. Hover over spans for details.
Obviously, you should also avoid parsing the workspace root pyproject.toml 131 times.
But even if you parse every pyproject.toml only once, large workspaces such as airflow have an overhead: uv run needs to check whether any dependencies changed, and that needs to look at each local package and parse its pyproject.toml. Registry dependencies stay the same by contract (and hashing), while other dependency kinds may change. Some are only updated on demand (git dependencies), others follow caching rules (http dependencies), but for local packages, we check on disk. For airflow, it takes ~20ms just to check whether the lockfile is satisfied, almost entirely for workspace member parsing (the "satisfies" bar in the plot above).
For registry, git and http (as in link to a file, not as in registry-over-http) dependencies, uv stores the metadata for registry dependencies in a zero-copy format from rkyv. With rkyv it only needs to do the minimal validations against undefined behavior, the data on disk is in the same format as the in-memory representation, no parsing involved. Loading those is fast (though not entirely memory efficient at the moment) and makes validation fast.
Prefetching
The pubgrub algorithm works by always asking for metadata for the next step: After selecting a package, tell pubgrub which versions that package has. After selecting one of those versions, tell pubgrub the dependencies of that version. If we fetched the metadata as pubgrub requests it, the resolution would be largely waiting for network requests to finish, or worse, a source distribution build.
From the partial solution that represents pubgrub's state, uv knows which packages will be included and what their current version constraints are. It does a prefetch for the metadata for those packages and the metadata for the currently best version in parallel, so that it's ideally already loaded when pubgrub asks for this information.
Figure 3: Comparing regular prefetch and no prefetching for jupyter.
If a build is required to obtain metadata, this build is also started in parallel in the background. The guesses for included packages and especially the versions can of course also be wrong, getting invalidated as we have to backtrack or new constraints come in, in which case we fetched useless information.
This prefetch requests one compatible version per dependency it sees. For some cases, such as when boto3 conflicts with the urllib3 version through botocore, we have to try a lot of versions of boto3 and botocore to satisfy the urllib3 constraint, and for each we have to fetch dependency information for that version. When uv tried several versions of a package, a separate batch prefetch starts requesting more versions in increasingly large batches. It starts with versions compatible with the current partial resolution and continuing with incompatible versions once the compatible ones are exhausted. For the extreme but still real world case of boto3, batch prefetch reduces cold cache resolution time from 40s to 2s.
We pay for batch prefetch with a cpu cost, tracking which versions were already requested, and if activated, requesting lists of compatible versions. In the boto3 warm cache case, that makes about 16% of the runtime.
Figure 4: Profile of the warm cache resolution of the boto3 benchmark (urllib3<1.25.4 boto3), with the batch prefetch section highlighted.
Figure 5: Comparing regular prefetch, batch prefetch, both together, and no prefetching on the highly contentious boto3 benchmark (urllib3<1.25.4 boto3).
The best way to see the difference is to visualize each request on a timeline.
Regular prefetch only (33.5s) unfiltered

No prefetching (16s) unfiltered

Regular and batch prefetching (1.4s) unfiltered

Figure 6: Instrumented tracing spans for the cold cache boto3 benchmark with regular prefetching only, no prefetching, and both prefetchers. The x-axis is time, and each bar is the duration of work of a specific kind (a span). Use the bar plot above for wall-clock timings, these tracing outputs are single instrumented runs. Each embedded plot uses its own time scale, so equal-duration spans appear much wider in the 1.4s plot than in the slower traces. The shared-scale versions below use one 34s axis for all three traces. Hover over spans for details. Only spans >0.005s are shown.
The same traces on a shared time scale
Regular prefetch only (33.5s) unfiltered

No prefetching (16s) unfiltered

Regular and batch prefetching (1.4s) unfiltered

Batch prefetch exists for a few cases that really need it. It activates both when resolving airflow and a fixture combining transformers' extras, including tensorflow. It doesn't make a measurable walltime difference for airflow, while for the transformers fixture, cold cache resolution takes 2.58±0.03s without it and 2.33±0.03s with it.
Missing wheels and dynamic metadata
Python packages come in two forms, source distributions and (built) wheels. If any wheel exists, uv can use the dependency information from the wheel during resolution, which is always statically encoded 10,11. When there's no wheel, modern source distributions (PEP 643, core metadata v2.2) can specify static dependency information12. If they don't, or when they use an older core metadata version, getting this information from a source distribution is a complex process that requires downloading the entire source distribution, setting up a separate venv with an independently resolved set of build dependencies and invoking python hooks.
A single source distribution build can be slower than an entire resolution with static metadata. If the source distribution requires building native code, it's even slower. Where wheel installs mostly take somewhere between 100ms and 500ms (median: 240ms), source distribution for platform-specific packages take seconds to minutes to build (median: 13s). The difference is too high to fit on a linear scale13.
Figure 7: Cold cache installing the top 1000 most downloaded pypi packages as wheel or from a source distribution. Packages were installed without runtime dependencies and walltime was measured, with 4 cold cache installs running in parallel. 9 wheels and 81 source distributions failed and were excluded.
In the worst case, uv may have to do this process for several versions of a package as it backtracks through finding a suitable version. During installation, it can use cached builds, but installing on a cold cache system needs to build all missing wheels, which is several times to magnitudes slower than the wheel installation process. An example for this is the airflow benchmark.
Simple api and missing index protocols
The index api for python packaging evolved from user-facing html pages of code archive downloads, and those simple pages started to get scraped by installers. The information about the dependencies of package is then in a zip file with the code. A case where uv gets slow is when the registry14 doesn't implement PEP 658 (Static Distribution Metadata in the Simple Repository API) and doesn't support http range requests, an old trick that allows reading the metadata file from a wheel without downloading the whole wheel. When both are missing, uv has to download the whole file for each package, and in the bad case that we're backtracking on torch, we download hundreds of megabytes repeatedly. pypi supports both of these standards.
More fundamentally, it means that for each version the resolver tries, it needs to do another request to fetch the dependencies of that version from a separate file. The information a package manager actually needs is small, in most cases it's as small as the concatenated contents of project.dependencies and project.optional-dependencies, yet we have to pay a separate http roundtrip each time. On the uv side, each response is separate in the cache, so even with a warm cache we currently pay extra for loading the metadata for each version, while at the same time always loading the filenames for all versions. While rkyv is fast enough that other parts are slower, it's not very memory efficient.
Surprisingly, the gains we got from trying to add more metadata to index pages were not as good as i had expected. The string roundtripping made it of the slower in our experiments, except when only adding the information for the latest release.
From being originally html pages (which are still widely used), there's now a proper json interface (PEP 691) for the index. pyx uses msgpack instead of json for a ~10% speedup in parsing. The msgpack files are also ~10% smaller, while being a drop-in replacement for json. Similarly, switching the cache from json to msgpack gave a 23% speedup, before switching the cache to an internal rkyv format.
Fundamentally, it's a list of filenames with links and hashes. That's kinda slow to parse. There is also a lot of redundancy in index pages. For example, there are many repetitions of the package name and requires-python.
The big advantage performance-wise of having a lockfile (uv.lock, poetry.lock, pylock.toml, not requirements.txt) is that you can skip the simple api during installation, all download urls are already recorded in the lockfile.
Version representation
Surprisingly, a big bottleneck is the type used for representing package versions. The index page for a package gives us all versions of that package, while all clauses in the resolver use versions as literals, so we create, copy and compare a lot of versions. So much, that with a naive version type, benchmarks are dominated by version operations. This isn't specific to uv, it's the same for pip and packaging.
The key is uv using an optimized version parser and version representation, using a limited but optimized version type where possible, while wrapping the remaining versions in a reference counted type.
Internally, the version type is a rust enum (a tagged union)15, one variant being a small type for a subset of versions that fits into 8 plus 8 bytes 16 and the other being a pointer to a large, heap allocated type that can represent any spec-compliant version17. The small type can represent three part versions with components <256 and an optional small prerelease. Its bytes are ordered in the same way that versions are, so that version comparison is an 64-bit unsigned integer comparison and copying is a 16 byte copy; primitive operations that the cpu can execute in a single step.
To speed up copying and equality checks for the large variant, it's wrapped in an Arc, rust's thread-safe reference counting type. While constructing the large variant may take multiple heap allocation, for example for strings in local version segments, the Arc itself is only pointer-sized, wrapping a heap allocation of reference count followed by payload. Arcs are generally fast: Copying an Arc is atomically adding one to the refcount, while dropping an Arc is atomically subtracting one from the refcount and checking that it isn't zero (and we have to actually deallocate). With versions being the core unit in the resolver, those operations easily add up to notable overhead.
The difference between the small version variant and the Arc'd large version shows in packages with a huge number of releases that don't fit into the small version. For example, even with a warm cache, it takes 500ms resolving and reporting that all version of tensorflow-io-nightly are incompatible python 3.14, as this package has a huge number of releases that all have dev version too large for the small version variant. (In comparison, finding a valid solution on python 3.10 takes 40ms.)
We get a more direct comparison by removing the small variant, which makes warm cache resolving boto3 2.1x slower (490ms into 1030ms). Additionally replacing the Arc in the full version with a Box, which copies its entire contents for each clone of the version, the slowdown becomes 4.7x (490ms into 2270ms). On the other hand, in this case removing the Arc optimization without removing the small variant has almost no effect: Almost all versions in the boto3 benchmark fit into the small variant.
optimized
no small version
no small version, no Arc on the full version
Figure 9: Performance ablation of resolving the boto3 benchmark with uv. The first flamegraph (top) is the optimized version. In the second (middle), the small variant is removed, and the version comparisons become notable. In the third (bottom), both the small variant and Arc optimization are removed, and version cloning and dropping starts to dominate. Note that they while they have the same width, they represent increasing amounts of time. There's a 0.1% runtime threshold for frames to be included.
Figure 10: Inverted call tree of resolving boto3 with the small variant and Arc around the full version removed from uv's version implementation (uv_pep440). It is filtered to stacks involving uv_pep440::version. The inverted call tree summarized the leaf, so e.g. all version comparisons a grouped together, listing the callers as children.
Markers and other metadata
Another important packaging type are platform markers. In python, they are arbitrarily nested boolean expressions. uv represents them with algebraic decision diagrams, one of the few locations with a classic algorithms and data structures optimization.18 This marker representation is canonical, deterministic and allows queries such as whether one marker expression is a subset of another. In this representation, all decision nodes (say python_version >= "3.14") are interned into a concurrent, append-only vector and referenced as indices. The index is never freed, the nodes isn't worth it. For airflow, there are 1k interned nodes for a total of 368KB direct allocations, against a peak RSS of 139MB.
The three other metadata types closely coupled to versions and markers that are also being repeated a lot are package names, extra names and group names. In uv, those use a small string optimization 19, as many package and extra names are short: When a string is shorter than a pointer, don't do an extra heap allocation and instead save the data inline.
In pubgrub, everything is a package, or rather a virtual package. Information such as platform-restricted package selection and extras are encoded as a package each. Packages are interned in an arena: Each virtual package is mapped to a 32-bit integer at the crate boundaries, and internally, only that integer is used. This speeds up pubgrub benchmarks, but in uv the difference is below the noise threshold, as uv already Arcs those types for cheap clones and comparisons.
Hashing
uv needs to check the hashes of all artifacts it downloads, to ensure they haven't been manipulated20. Using sha-256, this is notably slow. While secure hashing is inherently expensive, a different hashing algorithm such as blake3 would be faster. uv currently follows sha-256 being the ecosystem standard and precomputed sha-256 values being widely available from registries. This would not speed up downloads, which are generally network-bound, but would reduce cpu load during downloads and can potentially speed up concurrent work. While we usually speak of faster methods, here it's a more efficient method.
The blake3 paper has a comparison both for different machines that shows how architecture- and instruction-dependent hashing performance is. On a 2019 high-end server, blake3 is 14x more efficient than sha-256 (Fig. 3 in the paper). This machine has avx512 extensions for blake3, that most consumer processors don't have, but lacks sha-ni extensions, which speeds up sha-256 on newer consumer machines. On a raspberry pi zero, blake3 is only ~30% faster (Fig. 5), looking for inputs between the median wheel size of 40KB and the mean wheel size of 2.7MB. When hashing a 1GB file for a simple (non-rust) benchmark, on the linux desktop sha-256 takes 1.3s, blake3 280ms (4.7x speedup), on the raspi it's sha-256 6.5s, blake3 3.1s (2.1x speedup) 21. As the network requests run concurrent with each other and with other work, but file chunks arrive in order, we only consider singlethreaded hasher performance.
Virtual environments
Installing python packages involves copying all files from the packages into the site-packages directory of the venv for each installation. Even if you reflink them (also known as copy-on-write, supported on the default mac filesystem, some linux filesystems and rarely on windows) or hardlink them, and even if you do this with a thread per package, you still have to walk the whole source tree and copy it. There is no fundamental reason why python can't use packages from a centralized store, as other ecosystems do.
The packages in the cache are already unpacked and in the correct general shape for python to import, the installation process largely duplicates the existing tree.
Installing transformers[torch] (85ms) unfiltered

Figure 11: uv pip install transformers[torch] into a fresh venv from a warm cache on linux (hardlinking). solve is the dependency resolution step; each link_wheel_files span installs one package from the cache, and the long ~70ms span is installing torch. Hover over spans for details.
uv recently switched to trying reflinking by default on linux, which is faster on the filesystems that support it (many servers and CI machines use zfs or xfs, but not the desktop default ext4), unless it's a filesystem where somehow reflinking is slower than hardlinking. It was also reported that copy is faster than reflink for small files on mac. There isn't a known way to detect which methods are supported without trying them, nor to know which one is the fastest. bun seems to be the fastest here, building large node_modules trees almost instantly.
Independent of performance, reflinking is the only sound choice: It's the only choice that both prevents duplicating 100MBs to GBs of files while also ensuring that venvs are isolated and modifying a venv doesn't corrupt the cache.
Figure 12: Installing plotly, a package with many files, and torch, a package with large files, on the most popular linux desktop filesystem (ext4) and one that supports reflinking (btrfs). Even though reflinking is slower, it's the better choice by preventing cache corruption.
A common myth is that venvs have overhead compared to the system interpreter or custom layouts prefixes, especially in docker. A fresh unix uv venv is a whopping 84KB, split between a handful of helper files, symlinks and empty directories. Especially in docker, venvs make multi-layer caching much easier, reduce the effect of distro customizations and provide better isolation. You should still use a venv in docker.
Figure 13: A venv created by uv.
Most of those files are small conveniences or compatibilities. A venv is perfectly functional without those files (and small either way).
Figure 14: A minimal, yet fully functional venv.
Compression
Wheels are zip-compressed with the DEFLATE algorithm22, while source distributions are gzip-compressed tar-archives. DEFLATE (1990) and gzip (1992) both produce larger files with slower decompression than modern compression algorithms such as zstandard (2015). uv uses a streaming zip and tar decoder, to combine downloading and unzipping into the cache, so the network connection is usually ratelimiting. But besides the higher cpu load, the larger download sizes over zstd are notable.
Even within a single compression format, implementation details such as buffer sizes and seeking vs. streaming matter.
Backtracking
uv uses pubgrub for dependency resolution. Check out this page and the linked pubgrub docs on how uv's solver works - it's too complex to repeat here. The talk uv: an extremely fast package manager also has a great explanation, including some of the algorithmic and implementation optimizations. Pubgrub is responsible when uv is fast during complex backtracking scenarios and also when it gives helpful error messages about failed resolutions23. I'll only talk about some uv-specific topics here.
In a basic pubgrub implementation, once you choose a package, you try versions from most preferred to least preferred (newest to oldest), only discarding a version once you can prove that no solution is possible. A bad decision early on can lead to trying a lot of versions, only to fail at the same conflict over and over again. uv extends the basic pubgrub algorithm to record which packages are involved in a conflict. When two packages involved in a conflict cause too much backtracking, uv switches their priorities and manually backtracks to start with the other package instead, allowing pubgrub to explore a different part of the solution space. There is a detailed write-up of the problem and the solution on github. A limitation is that this doesn't work if the conflict occurs through an indirection.
uv has to be somewhat conservative when it comes package priorities and heuristics, to ensure the robustness of the solution and to keep churn minimal, e.g. from updating a single package. A resolver that wants to be faster could e.g. pick packages and versions in the order in which it gets metadata. This would however mean that running uv pip compile or uv lock twice with no new versions could give different results. Instead, uv prioritizes based on constraint wideness (do ==1.2.3 before >=a.b.c) and the order of discovery. These criteria don't change unless a new versions are published, and even then keep the churn low. (Additionally, they are entirely deterministic if an exclude newer cutoff is set and the registry returns immutable data).
In the case of the missing optimization from above, we ended up not shipping the optimization. This would have been a behavior change in the resolver, and the library that initially motivated the change solved the problem with better dependency bounds in the meantime, so while it's technically an optimization, in practice it would have been user-visible churn with no clear benefit and the risk of regressing other cases.
What's notable is how consistently fast resolving is for libraries. When resolving the top 15k pypi packages by downloads with uv pip compile (warm cache), the slowest ones take ~160ms on my machine, without particularly strong outliers. How good or bad dependency structures worked in old tools, most notably pip, has shaped what subset of the theoretically SAT-hard space packages actually occupy: Library authors fixed conditions that were particularly slow with pip. A resolver can be fast by handling only the remaining patterns, and while it's easy to craft stress test examples, i'm not aware of any real-world examples where a warm cache uv resolve is notably slow. (If you got any, let me know!)
Concurrency is hard
Scheduling diverse network, disk read, disk write and cpu loads is hard. It's not intuitive that you need to put the resolver into its own thread even when it's mostly waiting for IO, as the resolver's cpu-boundness otherwise still makes network IO slower. There's also convenience and correctness vs. performance: uv likely isn't faster by using async/await than by using threaded IO, but there's a large async ecosystem and async abstractions combine well. There's a hard to quantify tokio scheduling overhead visible in uv. Still, uv is using a mixture of regular futures on tokio, spawn_blocking for cpu-bound blocking work on the tokio threadpool, rayon for parallel unzipping and installation and a subprocess pool of python subprocesses for bytecode compilation. A particularly hard to find case was that you need to manually yield when using a sync channel from an async function for better performance, so we eventually switched to an async channel.
Concurrency, especially when abstracted through a framework like tokio, makes some bottlenecks harder to see. If all IO is off the main thread, is any read blocking overall progress? Is profiling flagging tokio channel code actually tokio being slow, or are we waiting on the other side of the channel? Do we have the correct sizes for queue buffers, number of concurrent operations (per kind), number of (tokio) threads, boxed futures, etc.? I haven't found any good tooling yet for either async-aware profiling or a profiler creating a blocking profile, which looks at the DAG of execution and only points out those operations blocking the application from progressing.
There's also a lot of file locking and atomic moves to ensure that uv processes running in parallel can't break another. It's hard to lock all potentially parallel IO operations and if you combine it with internal concurrency, you run into too-low default ulimits that haven't changed in 20 years24, but despite various large projects dealing with this problem, no standard has emerged on how to handle this on the application side.
On the upside, concurrency is key to uv's performance. We can simulate a singlethreaded uv with mostly serial network requests by setting the concurrency limits for network, builds and installs to 1 each25. Resolving airflow from a cold cache takes 26s instead of 16s, a cold cache jupyter resolution takes 762ms instead of 200ms, and installing jupyter from a warm cache takes 106ms instead of 73ms. The broader the dependency tree and more time uv spends waiting e.g. for network latency, the higher the difference.
Interpreter discovery
Unlike pip, which must run inside the python interpreter it installs for, uv can work with any python interpreter. It needs to query a host of information from the interpreter, such python version, installation location, system paths, abi variants and libc from various std modules and even use ctypes for libc detection. The actual script is lightweight, but spawning the interpreter, doing the imports and writing back the results, it takes about 30ms total for python 3.14. That's ~25% of uv pip install --no-cache tqdm. It gets cached after inspection (with invalidation through --refresh) when the underlying python interpreter is updated and for configuration changes.

This may improve in the future, when build-details.json will provide a lot of interpreter information statically.
Unreliable network
Some environments, such as github actions have (as of writing) unreliable networking and high failure rates. If a download fails mid-request, which happens a lot in a large CI matrix, uv needs to handle those failures, under some conditions restarting the download from the beginning26. Similarly, if a server replies with intermittent 4xx or 5xx codes, we have to retry and/or wait for the server to recover.
While not exactly a performance optimization, uv has grown an elaborate setup for retrying both regular and streaming http requests, to be resilient against all kinds of network failures.
Lack of batch refresh
If you uv pip install, uv caches (for pypi) all responses for 10min, following pypi's caching headers, then it has to revalidate. But there's no endpoint to ask whether all packages are fresh. uv needs to send n revalidation requests for n packages. Those ideally all return 304 not modified, but if n is larger than the network parallelism (50 by default27), it takes a multiple of the roundtrip time. This applies similarly to uv lock/uv lock with --upgrade or uv add.
Forking
Historically, python packaging did only consider the current platform, and only the current python version. This led to some packages having explicitly or indirectly conflicting requirements for different platforms, and installing different versions on dependencies on different python versions. I'll keep the resolver background short again, you can find the details in the resolver reference.
From the perspective of the resolver, this means sometimes we need to do separate resolutions for different platforms, which we call forking. It's not well-defined when to fork. Poetry splits resolutions when the resolution failed with a conflict and the conflict cause contains a fork opportunity. uv instead forks during the resolution (with failures being fatal). It forks whenever it finds a dependency list with different platform markers for the same packages or finds the latest compatible version of a package doesn't support the full python version range we want to cover28.
uv processes forks one after the other, starting with the full environment. Whenever a resolution arrives at a fork point, it continues with the highest priority fork and queues the remaining fork(s) in priority order. Usually, only the first fork does the full work of a resolution. Subsequent forks try to reuse the existing versions as preferences, and if they happen to be fully compatible with the previous fork, they can reuse the in-memory metadata and only have to try a single version per package.
Figure 15: The fork tree of a warm cache airflow resolution29, processed top to bottom.
Type layout
uv puts a lot of effort in avoiding unnecessary allocations, such as passing around references as default, Box to constrain type sizes, Arc for shared references, Cow to only allocate if an object was changed and small string optimizations 19,30.
Contrary to its reputation, rust doesn't default you to being great about memory usage and allocations. It allows you to pick and implement the optimal representation at any given location, but not with the default std types and idiomatic code. While std types are precise in the costs and behavior, they are rarely optimal and lack most opportunistic optimizations.
In comparison, a modern garbage collector does a lot to offset allocations and bakes optimizations into the language. In python, all objects are reference counted, while rust requires changing the type to Arc. Python has a free list of objects that gets reused, and java features a generational garbage collector to deal with short-lived and long-lived objects. In rust, you need to build or bring your own arena, and change all required places to arena types. You can't mix arena types with the non-arena types when using libraries, including a good chunk of std, at least not without paying a conversion cost both ways.
If you use String or Vec, you pay for the option to push more elements even if almost all Strings and Vecs are static after they are built. Heavily abstracted languages such as java and python can transparently use better std type representations such as better string representations and interning strings, while a JIT may choose further optimizations in hot areas31.
For some crude numbers: For a cold cache jupyter install, around 45% of the 440k total Vec instances would have fit in a SmallVec of the same size that would have avoided the heap allocation. Similarly, 48% of the Vec instances were only allocated once and then filled to that exact length, they wouldn't need the extra capacity usize. The measurements are excluding zero-sized instances and the locations where uv is already manually using SmallVec or Box<[T]>/Box<str> respectively. Those aren't the biggest walltime improvements (without uv's currently used small strings and small vecs, it gets slower somewhere between 1.7% for trio and 7.3% for boto3, the allocator buffers a lot of the small allocations), rather, they could improve performance and lower RSS without application level changes.
Keeping type sizes in check requires asserting them in tests and sprinkling Box wrappers in the right location, including for error types (which determine the size of the entire return type) and for futures (which are compiled to state machine that include all local variables). uv has assertions about type sizes in critical locations and has to Box::pin future in high level functions just to contain their size. While rust does use some niches so that e.g. Option<Box<T>> is the same size as Box<T>, there's also many niche optimizations it's missing, such as for constrained integer types and especially around nesting enums with structs.
Some types in uv could be smaller, such as the Dist type representing any possible installable source between a wheel in a registry and a git repo subdirectory: All objects include their children directly by default (not references to their children), and enums have the size of their largest variant recursively, leading to excessive memory use, especially for serialized optional values.
Don't get me wrong: All of these techniques are also possible in rust, and they are faster when implemented in rust. Not paying for GC is a priceless benefit, the performance of heavily optimized rust is simply not reachable in a GC'd language. Rust provides precise control over allocations and memory layout, allowing to pick the optimal bytes in critical paths without sacrificing safety. The std types are reasonably fast, and a basic rust implementation is generally faster than the same basic implementation in a GC'd language. What rust is missing is a handwavy mode in which you can tell the compiler that you don't need the exactness of String or Vec or layout guarantees for your custom type, and have it apply optimizations on its own. For most values, the compiler can see its entire lifecycle and should make much better decisions on a program scale than us manually.31 If you want to avoid allocations and similar costs, you instead always have to pay with coding overhead and complexity and through patterns such as lifetime annotations, iterator chaining and custom type layouts. This requires both knowing all the techniques and applying them manually.
Many libraries try to protect the user from a clunky api and breaking changes for optimizations by using faster type beyond the API layer, such as wrapping them into Arcs. There is only coarse information about this in rust's api contract. A type can be Copy, when duplicating it is simply copying bits (such as a u32 or an enum tht doesn't cary data), or Clone, for all other copies. Arc implements Clone, but not Copy. You implicitly start relying on the performance implications of something that's otherwise intentionally hidden from the public API. There was a performance regression in building wheels caused by replacing one zip crate with another, where the new zip crate didn't wrap its archive type in an Arc, making clones expensive.
Allocating memory
Rust uses the system allocator by default, which is comparatively slow, on musl doubly so than on glibc. There are a few other production grade allocators for rust to pick the optimal one for your workload, uv is using jemalloc and mimalloc. I bet an allocator optimized for rust instead of C/C++ usage patterns would be faster.
A location where uv isn't optimized much yet is memory usage. For example, uv takes 110MB just to say that the lockfile is fresh, with a total of 10.7GB and 8.8 million allocations for a warm cache uv run in airflow:
Figure 16: A local codspeed memory profiler run for warm cache uv run, uploaded to codspeed.
Large memory usage can point to inefficient operations that cause it, algorithms that allocate too much (such as the version type), reading too much data from disk or missing deallocations.
On the flipside, the reports about OOM errors we could confirm were caused by source distribution builds, not by uv itself.
Freeing memory
Rust uses the Drop trait to recursively free data structures and to run pre-free hooks, such as decreeasing the reference count in an Arc. To deallocate an object or a collection, drop() on the object or collection first needs to call drop() on all of its members. This can be slow, for example when having a large number of Arc'd versions where each drop is an atomic refcount decrease and check if the count is zero to deallocate the object it wraps, especially combined with large data structures such as the distributions and incompatibilities built up during a resolution. In the airflow benchmark, 1.4% of the resolver runtime is dropping the resolution data structure after the resolution finished. uv partially gets around paying for this as the drop happens in the resolver thread after it transferred the results to the main thread, so the drop is parallel to the main thread.
Rust libraries
The scope of packaging include dozens of staple formats (toml, json, csv, html, cfg, email, zip, tar, msgpack, deflate, gzip, zstd, brotli, base64, X.509, dotenv, off the top of my head), a network stack and interacting with all sorts of different operating system apis for windows, mac and linux. The ecosystem for those plays a big role in application performance.
Some rust crates are faster than their C/C++ counterparts, such as rustls, zlib.rs and bzip2. In other cases, rust bindings are slower, such as the mysteriously slower zstd bindings. More often, rust makes it feasible to use certain optimizations that would have otherwise failed or would have been too risky.
Fat wheels
Some wheels need different compiled artifacts for differences that can't be expressed in wheel tags. Numpy functions get compiled for different sets of cpu extensions, introduced in different cpu generations, which are merged into one big binary with runtime dispatch (NEP 38, living docs). Torch similarly compiles its nvidia gpu code for a number of microarchitectures (streaming multiprocessor architecture, not cuda) and merges all of them into a binary that's somewhere between 100MB and 2GB. This is hugely wasteful, there's no support for selecting only specific wheel variants yet. Projects without the resources of numpy or torch generally build against the oldest supported hardware only (at least for pypi), so uv installs code that's slower than necessary at runtime (or worse, fails on old machines).
System and abi dependencies
Some packages, such as psycopg2, mysqlclient, flash-attn, a number of scientific packages and a number of hardware integrations, don't ship wheels because they depend on system headers or on the specific version of an already installed library. The most popular packages now ~all ship wheels, but the remaining non-wheel packages are a noted pain from many users, both for performance and for setting up a build environment outside uv.
Python interpreter
Python build standalone providers the fastest cpython build on linux, mac and windows by using compile time tools such as LTO, PGO and BOLT (on windows, there's not much difference between the builds). You can install it with uv python install, poetry python install or hatch python install. uv initally used them cpython builds because they aren't pinned to a specific installation location and because they are available on a wide range of python versions on all major platforms and architectures, but now they are also the fastest.
Unfortunately, glibc is consistently faster on linux than musl, both for the python interpreter and for uv itself. While musl makes a lot of things such as version compatibility and static linking easier, and while using a custom allocator makes the performance difference much smaller, core operations such as memcpy are still faster with glibc. So unfortunately, musl is not recommended as a python docker base image.
Tooling
This section is about all the great tools that make these investigations possible.
criterion is our benchmark harness and codspeed provides our continuous benchmarking. I want to shout them out for being very responsive when we report problems. The codspeed web interface has a flamegraph diff tool, though that works badly now that most work is off the main thread.
Below, you can see a small regression from a correctness fix we merged32:
Figure 17: Codspeed's benchmark history for the warm-cache airflow resolver benchmark from 2026-02-15 to 2026-03-15, showing the regression from that correctness fix. Codspeed shows the full benchmark history.
A mixed experience is benchmarking with instructing counting: When running the exact same code twice, the walltime is a bit higher or lower depending on how much else is happening on the machine. In theory, we should get less noisy numbers by instead getting the number of instructions the cpu executed from valgrind. Unfortunately, that number doesn't handle the allocator well and it is sensitive to how we count different instructions, so it's less noisy, but sometimes jumps around when there is no walltime change.
For local profiling, i use samply, which uses the firefox profiler website, and for benchmarking, i use hyperfine, which very helpfully includes standard deviations, so you can tell what's below the noise threshold and what's real. While criterion includes a p-value natively, hyperfine can do t-tests through a separate script. The one big drawback is that it runs one set of benchmark runs after the other, instead of paired runs, where you alternate the two cases to be more resilient over something external (say cpu temperature or network throttling) changing during the benchmark run.
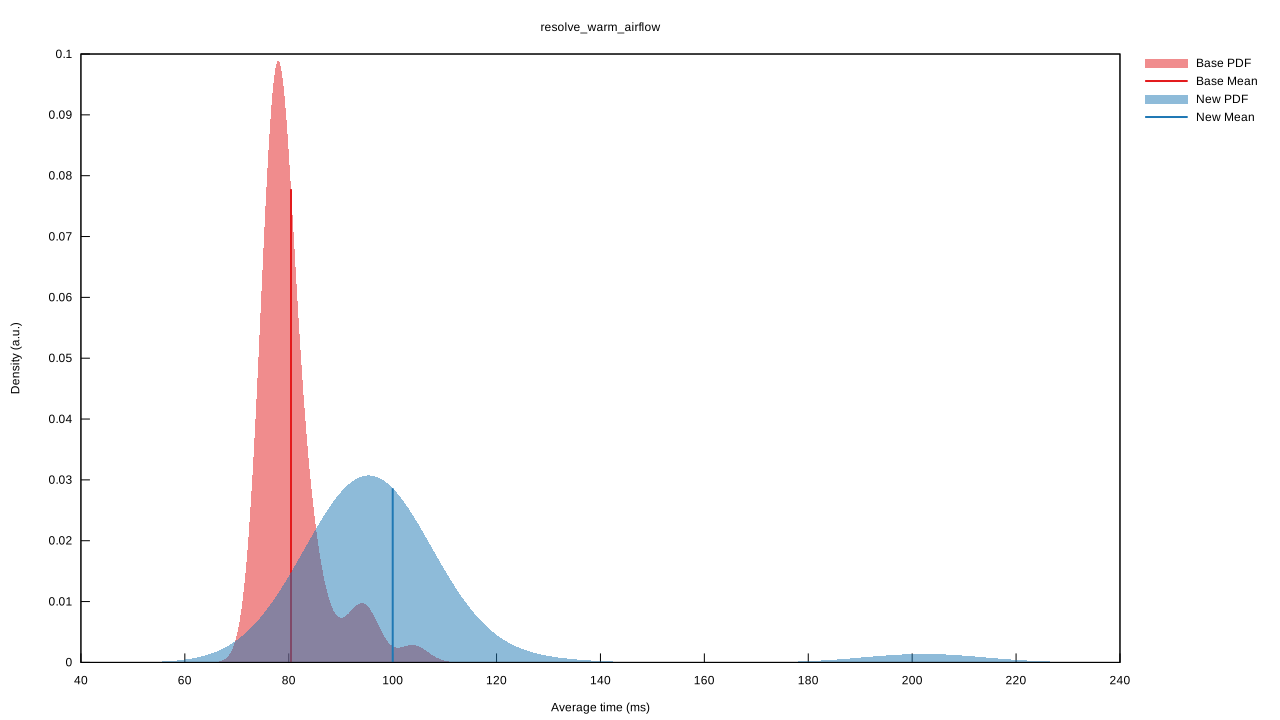
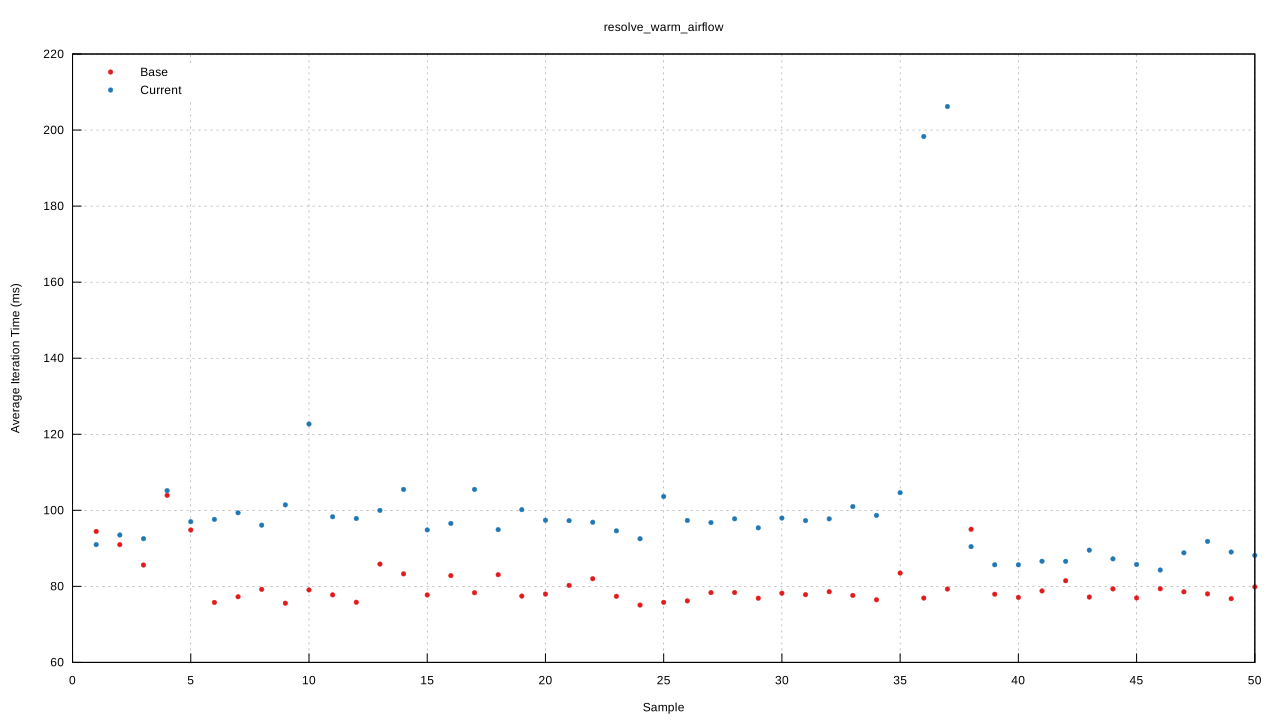
Criterion report: resolve_warm_airflow
| Statistic | Lower bound | Estimate | Upper bound | Significance |
|---|---|---|---|---|
| Change in time | +17.763% | +24.343% | +32.925% | p = 0.00 < 0.05 |
Performance has regressed.
Figure 18: A criterion report from a noisy machine, causing the two outliers. Criterion features a t-test, where a high p-value means low confidence that the result isn't noise, you're usually using only p<0.05 values (but avoid p-hacking by running many tests). The report has been edited for size and design consistency, full report for more plots and statistics.
For understanding concurrency including blocking vs. non-blocking code, we use logging and spans through tracing. The span visualizations are exported with tracing-durations-export and edited for clarity and responsive layout.
The different measuring tools have different facets: Release walltime is the only real value for users, but it doesn't give us any information about what and where uv is slow, and it takes too long to compile to properly iterate. Using cpu profiling information allows optimizing cpu bottlenecks, but it can't tell us if uv is mostly waiting on IO, and you need a frontend such as samply to look at concurrent threads. Using tracing spans gives us better concurrency insights, but only for annotated functions, only after logging was initialized and carries an overhead that slightly skews the numbers.
There were several patches used for measurements:
- Ablation stury of version optimization:
no-version-arc.patch,no-version-small.patch,no-version-small-no-version-arc.patch. - Marker node interner:
marker-add-interner-stats.patch Vectype layout uses an std (alloc, more specifically) patches:rust-1.99.0-exact-fill-rust-only.patchandrust-1.99.0-exact-fill-rust-only.patch.
Thanks to Jack O'Connor for help with the hashing section.
-
In python, high quality implementations are a requirement for adding a cpu-intensive operation to a packaging standard. For example, a (previous) blocker for zstandard was a missing std implementation. Since pip can't use any platform-specific code that doesn't come with (C)Python, operations it uses must either be implemented in python, or be part of the standard library. ↩
-
The benchmarks and profiles in this post were collected over a couple of months, they don't always measure the same pypi state and they are not always measuring the latest uv version. ↩
-
Using the mid-march 2026 snapshot
7fa400745ac7aebc7cc4ec21d3a047e9fb258310with python 3.12 on ubuntu 24.04. You can get some reproducibility with--exclude-newer 2026-03-18, but as new distributions are published, the size of the server responses increases, which slightly changes the numbers. For scale, the warm cache boto3 benchmark that takes 420ms on my desktop machine and 3s on a raspberry pi 4b. ↩ -
While uv is technically a SAT solver, the cases that exist are very specifically shaped, often driven by what earlier tools would support or struggle. While this case has a lot of backtracking, it's not very SAT-shaped in the generalized sense. It's important to pick realistic examples, rather than artificial or stress test benchmarks that do not represent real workloads. See also the talk Gotta Go Fast. ↩
-
As a general note, the walltime numbers in this post aren't overly exact, and sometimes even show some divergence between different runs of the same benchmark. Due to the diverse kinds of resources uv uses (network (pypi, cloudflare cdn, github, other internal and external registries), disk, cpu (singlethreaded), cpu (multithreaded), cpu-accelerated code such as sha-256, different concurrency frameworks), bottlenecks vary. It doesn't make too much sense to optimize for getting exact low noise numbers on a specific machine when this doesn't match how the application actually runs. For example, I get way lower variance by setting the cpu governor to performance and using
tasksetfor pinning the process to performance cores. But this also reduces startup time of short running applications (<50ms), while most users use the default cpu governor, or potentially the powersave setting on a laptop.When developing speedups, we instead focus on determining if something is a speedup beyond the noise threshold (there's enough of them that we usually that we don't need more sensitive benchmarking) or if there's another indicator for optimization, for example a flamegraph.
The numbers in this post are for giving a sense of scale. As another example, the profiling build i use for benchmarking (
cargo build --profile profiling --features tracing-durations-exportis 12% slower than a regular release build (cargo build --release), so all numbers using those builds are slightly shifted, as if they were running on a slightly slower machine.Another example is this amazing speedup in codspeed for last 3 month for airflow:
We switched to a faster server to finish the benchmarks quicker. ↩ ↩2
-
Cold cache means running with
--no-cacheor afteruv cache clean. It's what you get when building a fresh docker image or running in CI after cache eviction. Warm cache means running the same command with the same cache a few times before measuring. ↩ -
NTFS is mysteriously slow for a lot of things, including uv's own test suite, but i've never found an explanation why. ↩
-
Bun was using a binary lockfile for maximum performance, but migrated to a text-based format as a binary file is tricky to review, merge conflicts are hard to resolve and tooling can't easily read it. ↩
-
The toml and toml_edit crates are optimized on features, such as preserving spans on parsing for excellent error messages as well as style- and comment-preserving file edits. It's just not a performance audience, most people aren't bound by parsing configuration files. We use both its great error messages for configuration errors and its rewriting features editing commands such as
uv add,uv removeanduv version. ↩ -
If wheels could have dynamic metadata that changes depending on the host, sound lockfiles become impossible. It would also require per-wheel code to determine this on installation, which is a security and stability risk. Dynamic metadata here means that you need to run code to get the real values, it does not refer to e.g. platform-specific dependencies, which the package manager can evaluate with its own (or vendored) code, with platform markers being well-defined expression language. I believe that we should solve such problems with more expressive metadata. ↩
-
There's some debate over whether all wheels of a release need to have the same metadata, and whether source distributions need to build into wheels of that same metadata. While there's indeed no metadata consistency requirement in any spec, it is explicitly required by both poetry and uv - both fail when this assumption is violated - and the ecosystem follows this assumption. I'm only aware of two high-profile cases where old releases of tensorflow and torch accidentally shipped different metadata due to the complexity of their build systems, which was fixed in the following release.
It's technically possible to work around wheels having different metadata, though it's unclear why we want to add that complexity. Platform markers express dependencies across platforms in single dependency specification (PEP 621), while the overhead would be huge in terms of network requests and resolver complexity.
The other property is that source distributions are required to build into the same metadata as wheels (if any) or alternatively into the same metadata each time. This is required by every tools that uses a lockfile: You can't install from a lockfile if a package has a new or mismatching dependency at install time that was never considered in the lock. It would break our most important security mechanism if a dependency was not checked against hashes from a lockfile. Even pip behaves inconsistent when this property is violated. ↩
-
uv can also read from
↩pyproject.tomlif the name, version and fields for dependencies are static and PEP 621 compliant, but in that case the source distribution should really have static metadata too. Adoption tacker: -
I mean look at this:
↩ -
Index and registry are synonyms ↩
-
In rust, enum variants can have different members. In python terms, this would be a version protocol with the small and the large representation as classes implementing it. What Are Sum, Product, and Pi Types? is a great introduction. ↩
-
Ideally, it should be just 8 bytes and leaving a bit for the enum discriminant, while the current representation keeps a separate field for determining trailing zero, and rust is missing a u63 type that would tell the compiler to keep a single bit niche. ↩
-
Python version numbers have a huge amount of (historic) complexity. For new ecosystems, i'd be much tighter on what versions and version specifiers are allowed, especially around prereleases. The newer semver gets closer but is lacking in 0.x versions and prerelease handling. In my experience, you need a lower bound and either a) the range excluding the next breaking release, b) an explicit upper bound, excluding a known-bad version or c) an option to pin that version specifically. You also need a story for continuous releases. ↩
-
Those are technically an SMT solver, parallel to pubgrub being a SAT solver. ↩
-
See e.g. Fun with benchmarking small string optimization, I Wrote A String Type and many more under the category "small string optimizations". The general wisdom for picking a layout and implementation is to try different ones and see which one is fastest. A data-driven string choice (through or besides PGO) would be immensely valuable. ↩ ↩2
-
This prevents against attacks where the server that serves the file has been manipulated since the file was audited. It does not replace the part where you need to trust the author of the binary, but it makes this a one time trust, not a continuous trust that the infra is never taken over. Additionally, this is an integrity check: It ensures that exactly the locked configuration runs, and no one just quickly replaced the file with a patched version on the server and now you have different behavior depending on which build you get. It also enables using mirrors for installation, as we don't need to trust the index at deploy time anymore. ↩
-
Benchmarked with:
↩head -c $((10**9)) /dev/random > blob-blob hyperfine "sha256sum blob-blob" "b3sum --no-mmap --num-threads 1 blob-blob" -
There's no spec that says that they have to use DEFLATE, but DEFLATE is the default zip compression algorithm. Wheels almost exclusively use DEFLATE, and uv will remove support for rarely used compression formats to reduce the dependency footprint. ↩
-
Shout-out to Natalie Weizenbaum for developing pubgrub and writing about it, and to Matthieu Pizenberg and Jacob Finkelnman for writing and maintaining the pubgrub crate. ↩
-
If you're wondering about the unofficial link, that's because that value exists since pre-git. Linux 2.1.26 which introduced this was published in 1997. ↩
-
This technically still allows concurrency between the resolver and a single network request as well as a single build, and cache writing and reading is still concurrent, but it shows the effect sufficiently. ↩
-
uv has custom-built support for resuming interrupted streaming downloads. It's something that shouldn't be required at all in the application layer, as rust's tcp and http 2 implementations should be perfectly capable of dealing with interruptions by re-requesting dropped packages and not trying to use a broken connection again. For example, if i unplug and re-plug the network cable on my desktop machine, pending downloads invariably fail, despite being disconnected for less than the timeout. There's several cases like this, but beyond the linked reqwest bug, i'm not even sure how you'd debug that. ↩
-
I haven't found any resources on what an empirically good default for the number of parallel requests is, or generally for concurrency settings - if you do, please let me know! ↩
-
uv also forks if for missing platform support in wheel-only packages. Forking over platform markers and requires-python are the two most common cases, while the heuristics may change in the future. ↩
-
uv lock --exclude-newer 2026-03-18on airflow 7fa400745ac7aebc7cc4ec21d3a047e9fb258310 on the linux desktop. ↩ -
Arguably, we lose a bunch of free performance and memory because
StringandPathBufare mutable by default, when we really needBox<str>andBox<Path>instead.StringandPathBufare three words (pointers) wide, and may over-allocate. We almost never modify string or paths in place, and definitely not in hot loops. We would likely also profit from defaulting to small string optimizations, most strings in uv are small-ish and i don't think we require the array-ness often if at all (OS APIs require conversions to C string or Windows datatypes anyway). ↩ -
As example, the standard library has a
Boundtype.pub enum Bound<T> { Included(T), Excluded(T), Unbounded, }To represent versions, we need to build intervals, such as
==1.2.*being interval of[Inclusive(1.2), Exclusive(1.3)]and>4being interval of[Exclusive(4), Unbounded].struct Interval<T> { start: Bound<T>, end: Bound<T> }We can determine a good layout for
Interval<u32>: We have 3x3 different options for the bounds and twou32to store (which may be empty). The latter are 4 bytes each, while the 9 variants fit into 1 byte, so a total of 9 bytes. Due to alignment, which ensures that pointers not have odd addresses my x86_64 cpu doesn't like, the struct gets padded to a multiple of the largest member (a 4 byteu32), so we get 12 bytes total.If we check the actual size of
size_of::<Interval<u32>>(), it's 16 bytes. The general reply to this is that rust must allow referencing individual fields, so an&internal.startand&mut internal.startmust look like every otherBound<u32>. Each individualBound<u32>is 8 byte (4 for theu32, and the enum variant padded to the same size), a type with twoBound<32>must be 16 bytes.We can write the more efficient layout by hand.
enum BoundIntervalKind {
    IncludedIncluded,
    IncludedExcluded,
    IncludedUnbounded,
    ExcludedIncluded,
    ExcludedExcluded,
    ExcludedUnbounded,
    UnboundedIncluded,
    UnboundedExcluded,
    UnboundedUnbounded,
}

struct BoundInterval<T> {
    kind: BoundIntervalKind,
    // For all types with a trivial `Default` (such as `u32` or uv's `Version`),
    // this can just be `T`.
    start: MaybeUninit<T>,
    end: MaybeUninit<T>,
}
Here,
BoundInterval<u32>is the expected 12 bytes, with the same functionality, and can expose the exact same features on this type, but it would be more code harder to understand code than a compiler optimization. It is of course correct that it's possible to expose&internal.start, especially to callers across crates. I don't see though why the compiler doesn't check if these reference are actually taken, and if they are, it could optimize across the codebase for a better type layout. There are a few exception such as ffi and unsafe code, where the compiler can determine if the code gets tainted and skip the optimization. Alternatively, an annotation on the type could declare it opaque and ban certain kinds of references.The
Intervaltypes exists in pubgrub, with the exact problem describe. Another case isWheelTagSmall, also sits in the hot path and is unnecessarily large. ↩ ↩2 -
Writing this article, i think i figured out why. ↩